Turn raw Google Search Console data into plain-English SEO decisions — in minutes, not hours.
Every SEO has had this moment. You open Google Search Console, you’re staring at thousands of rows of queries and pages and impressions and average positions, and somewhere in that wall of numbers is the one thing you actually need to do this week. The data is all there. The answer is not.
Search Console is one of the most honest data sources in all of SEO — it’s Google telling you exactly how you show up in Google. But it hands you that truth as a spreadsheet and walks away. Turning it into “fix this title, refresh that page, this drop was an algorithm update, that one wasn’t” is hours of pivot tables, mental math, and pattern-matching that most site owners never have time for and most agencies bill a fortune for.
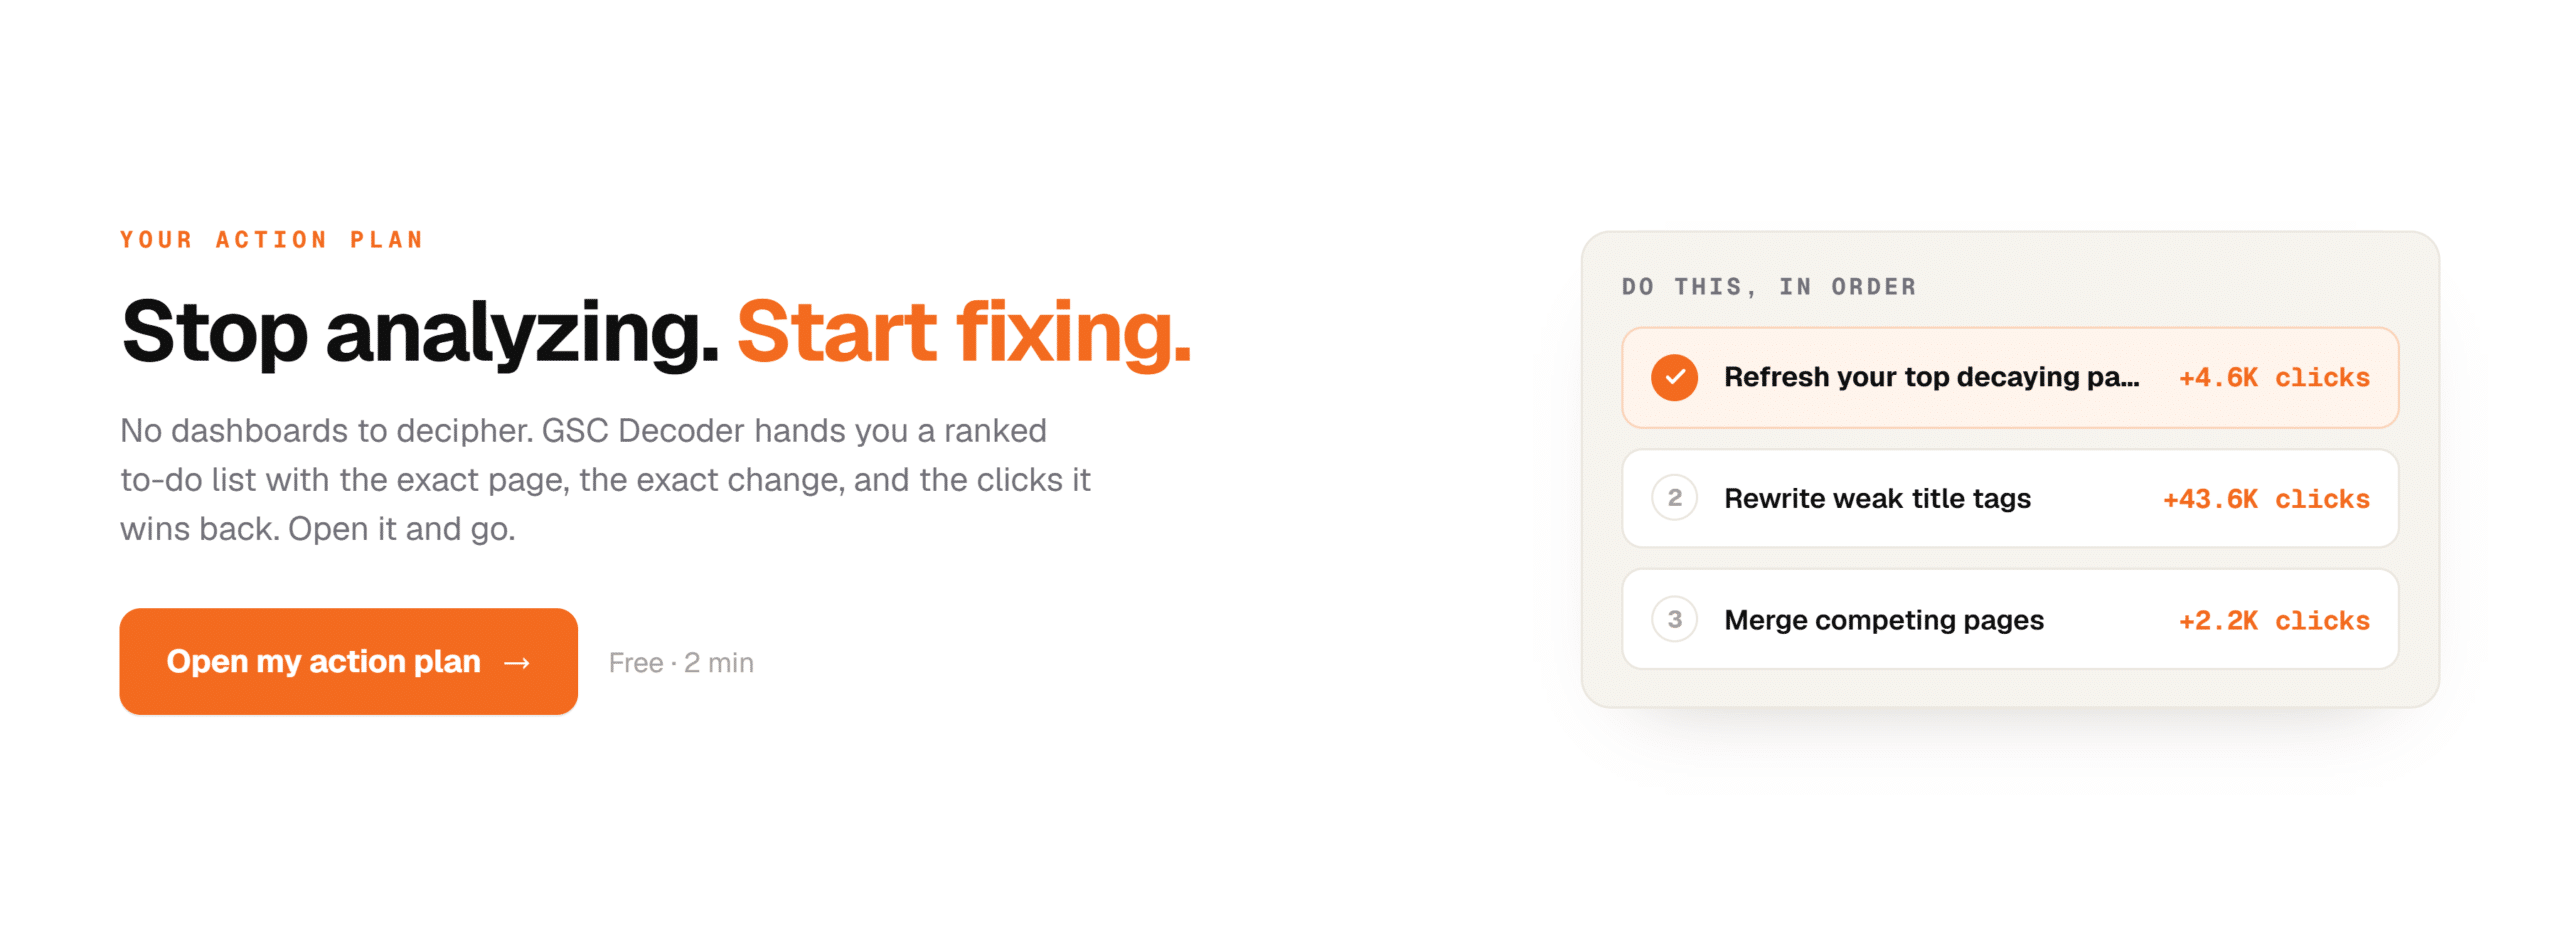
That’s the gap GSC Decoder is built to close. It reads your Search Console data and tells you, in plain English, what’s going on and what to do about it. Not more charts. Not another dashboard you have to learn to read. Decisions.
What the GSC Decoder actually is
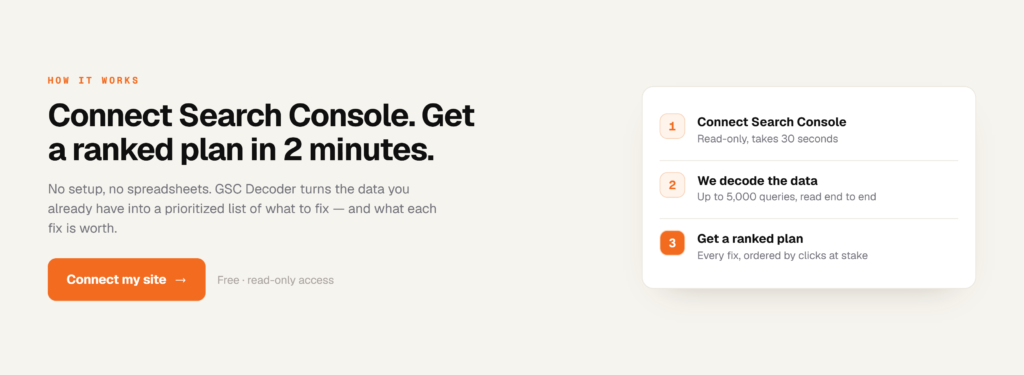
GSC Decoder is a tool you open and point at your own Search Console data. Connect your account — or upload your exports — and it renders a full analysis suite on the spot: roughly two dozen modules, organized into four clearly-labeled groups, every one of them written to answer a human question rather than display a metric.
There’s nothing to install and no spreadsheets to wrangle. You bring your data, and the tool turns it into decisions.
The interface is built around the way people actually work: start broad, then drill in. An Overview tab gives you the two-minute read — a health score, what changed since last period, and a short “right now, do this” list pulled from everywhere else in the tool. A Fix Queue turns every finding across every module into one prioritized, de-duplicated to-do list you can tick through. And when you want to go deep, the grouped tabs are waiting.
Every tab, with a real example
The tabs are color-coded into four families, so you always know what kind of question you’re asking. Here’s every one, with a concrete example and what it means for you.
Analysis — where to look first, and what changed
Overview
Your health score reads 72 with two critical items flagged, and the “Right now, Do this” list points to a page that has shed 340 clicks since last month.
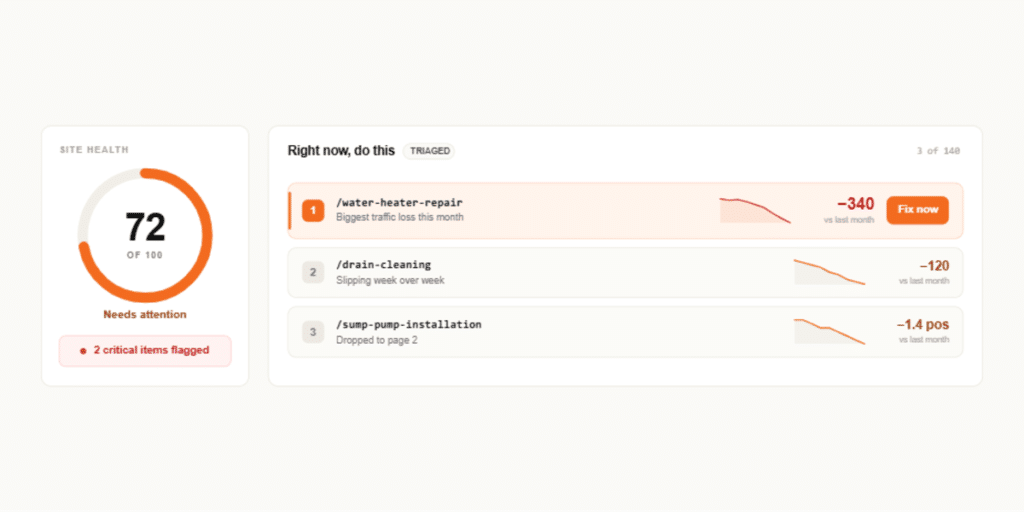
You skip the guesswork about where to start your week — the most urgent fix is already sitting at the top.
Fix Queue
A weak title on /water-heater-repair surfaces three different ways — in CTR Anomalies, in SERP Features, and in Keyword Opps. The Fix Queue folds all three into a single entry.
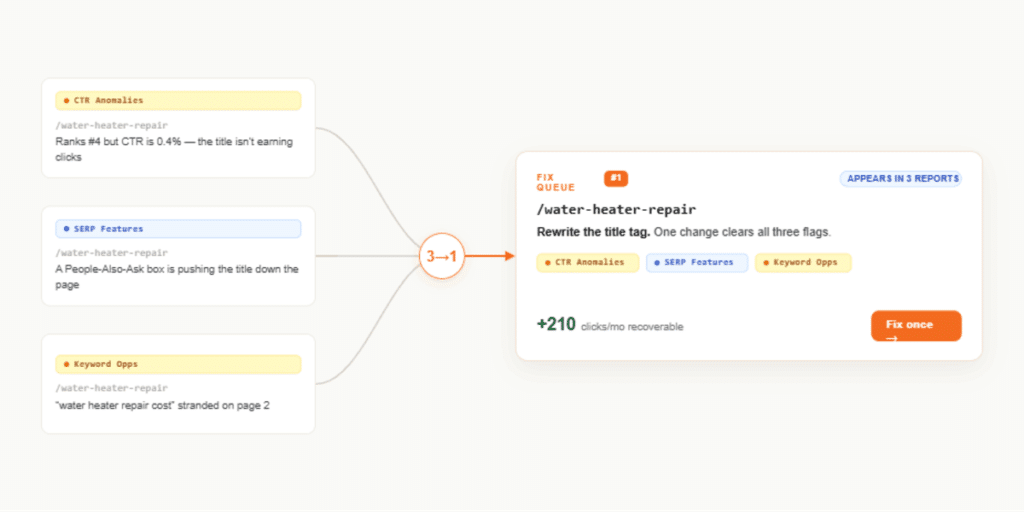
You fix it once instead of working the same problem as three separate tasks across three tabs.
AI Overview
You rank #2 for “how to fix a running toilet” with 4,000 impressions, but only 1.2% of searchers click — far below the ~13% that position normally earns.

An AI Overview is almost certainly answering the question above your result. The tab flags it so you can decide whether to fight for the box or pivot to commercial queries the AI doesn’t intercept — the “plumber near me” searches that actually book jobs.
Recovery
“emergency plumber [city]” drove 200 clicks a month last quarter and now earns zero — and the recency bucket shows the loss happened in just the last 28 days.
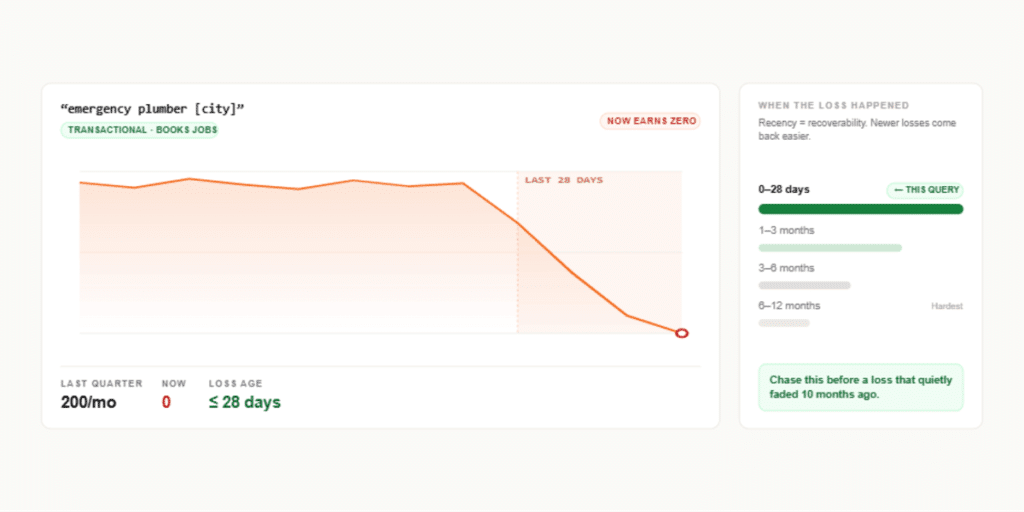
A fresh loss like this is the most recoverable, so you chase it before one that quietly faded ten months ago.
Click Drops
Clicks fell 38% on March 28, and the tab notes the date lands inside the March 2026 Core Update rollout.
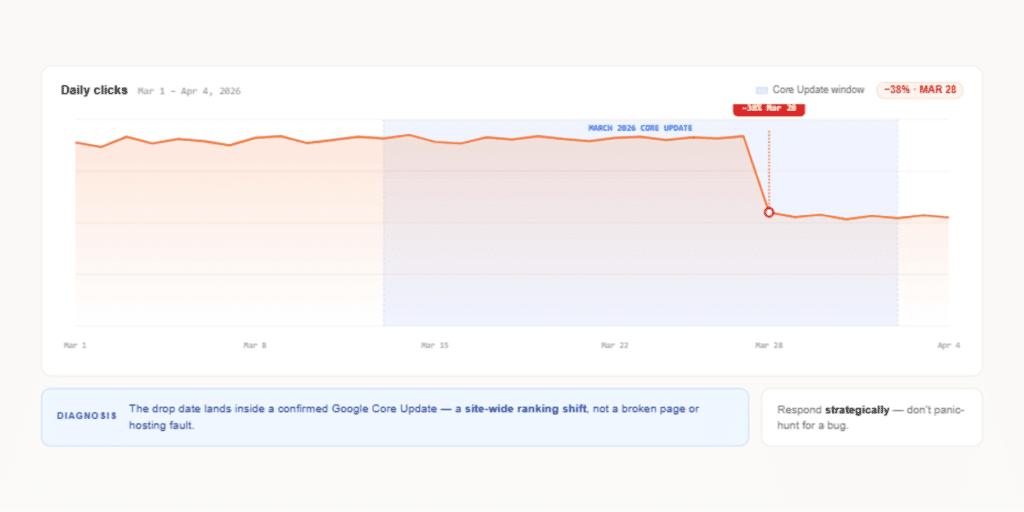
You stop hunting for a broken page or a hosting fault and recognize an algorithm shift — something to respond to strategically, not panic over.
Keywords — query-level opportunities and click problems
Keyword Opps
“tankless water heater installation cost” ranks #12 with 1,800 monthly impressions.
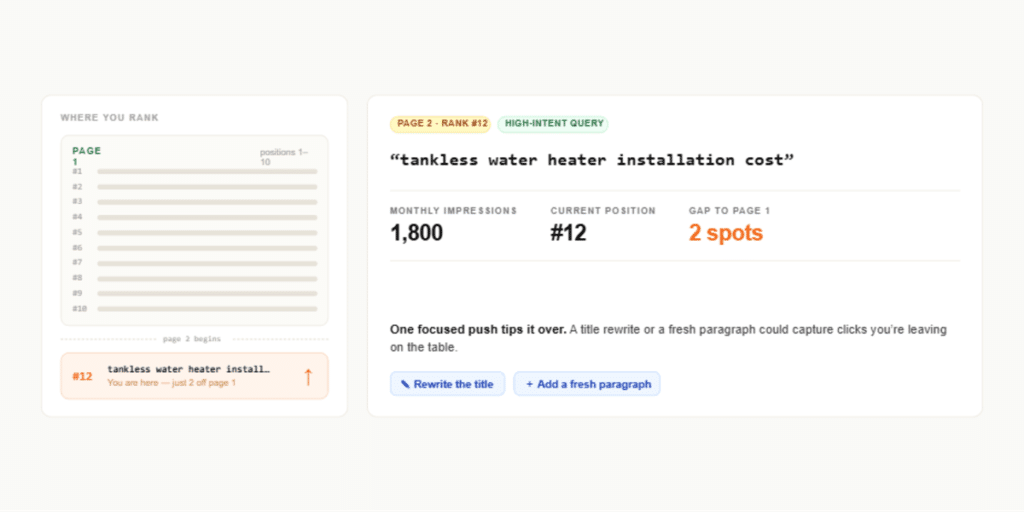
You’re one position off page one on a high-intent query — a focused title rewrite or a fresh paragraph could tip it over and capture clicks you’re currently leaving on the table.
CTR Anomalies
You rank #3 for “drain cleaning service” but only 2% of searchers click, against an expected 11%.
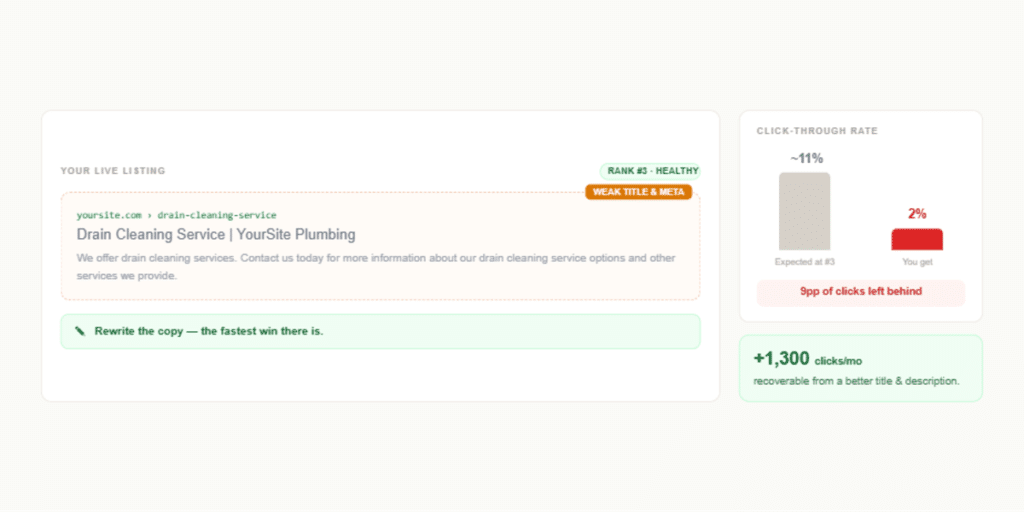
Your ranking is fine — your title and meta description aren’t pulling their weight. Rewriting them is the fastest win there is, and the tab tells you how many clicks you’d recover.
Click Curve
Your fitted curve shows position 1 earns 24% for your audience, not the 28% industry average.
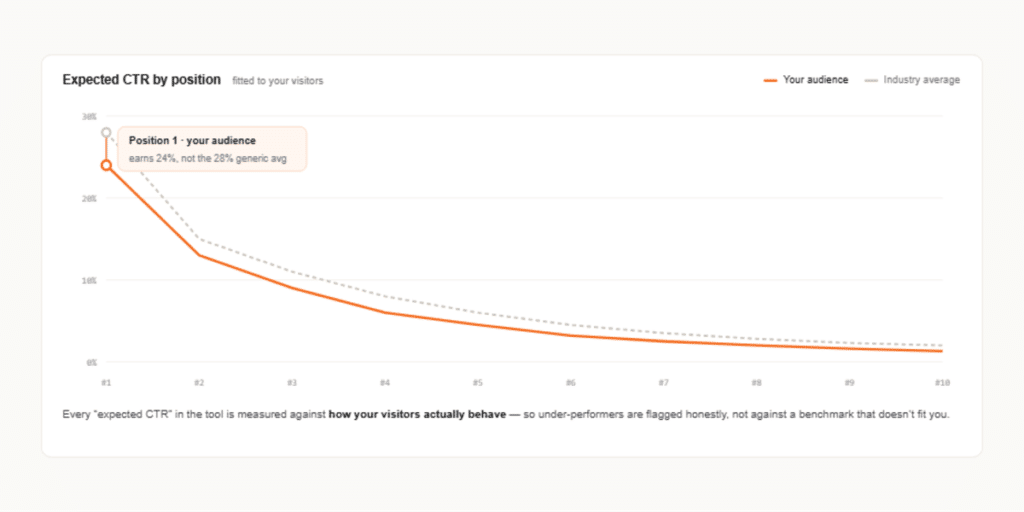
Every “expected CTR” judgment in the tool is measured against how your visitors actually behave, so under-performers are flagged honestly rather than against a generic benchmark.
Cannibalization
Both /drain-cleaning and /clogged-drain-repair rank for “drain cleaning near me,” trading places week to week.
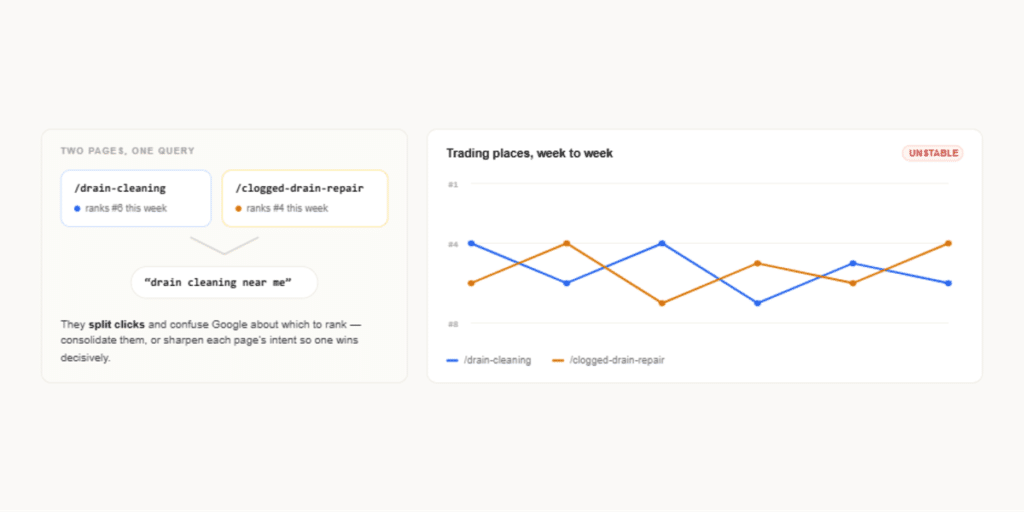
They’re splitting clicks and confusing Google about which to rank — you consolidate them or sharpen their intent so one page wins decisively.
Query Clusters
Forty separate queries about water heaters — repair, replacement, leaking, no hot water, pilot light — group into a single theme.

Instead of scanning hundreds of individual terms, you see a whole topic at once and can plan one authoritative page that covers it properly.
Topic Map
The map shows strong coverage of “drain” topics but a thin band around “sump pump” searches.
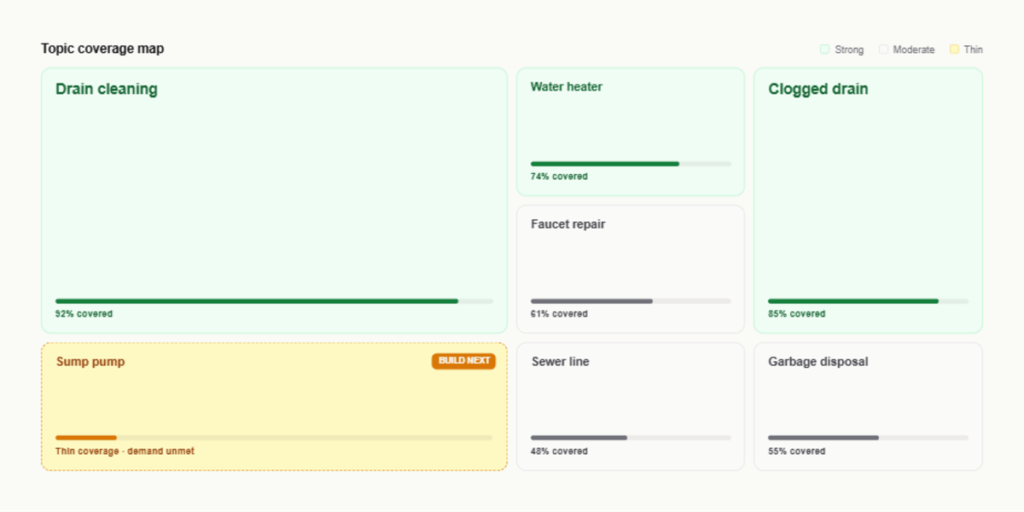
You spot an entire area where demand exists, but your content is shallow — a clear signal of where to build next.
SERP Features
“how to unclog a drain” shows a video carousel above your #5 result, and your click-through is a third of what it should be.
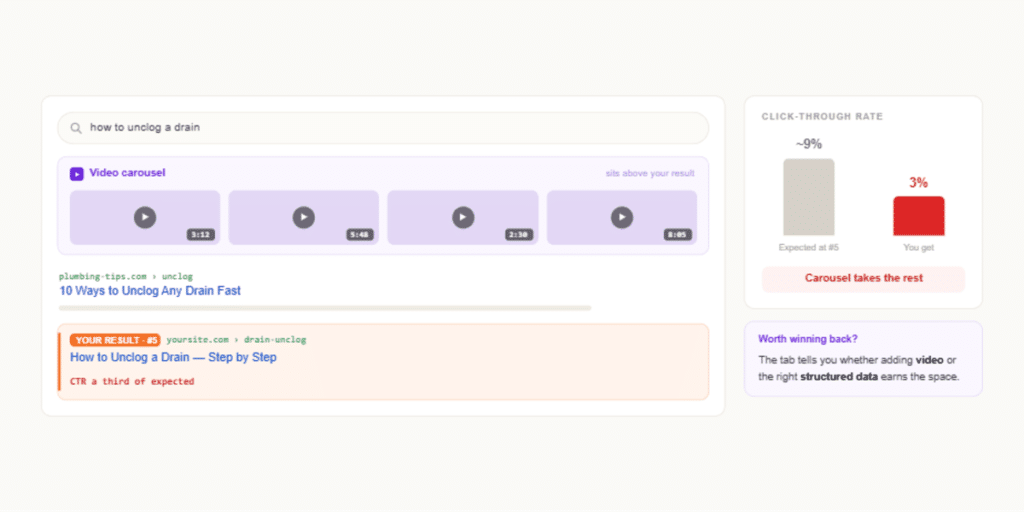
A search feature is intercepting the clicks, and the tab tells you whether adding video or the right structured data is worth the effort to win that space back.
Topic Gaps
Searchers reach you for “frozen pipe repair” 600 times a month, but no page on your site is actually about it.
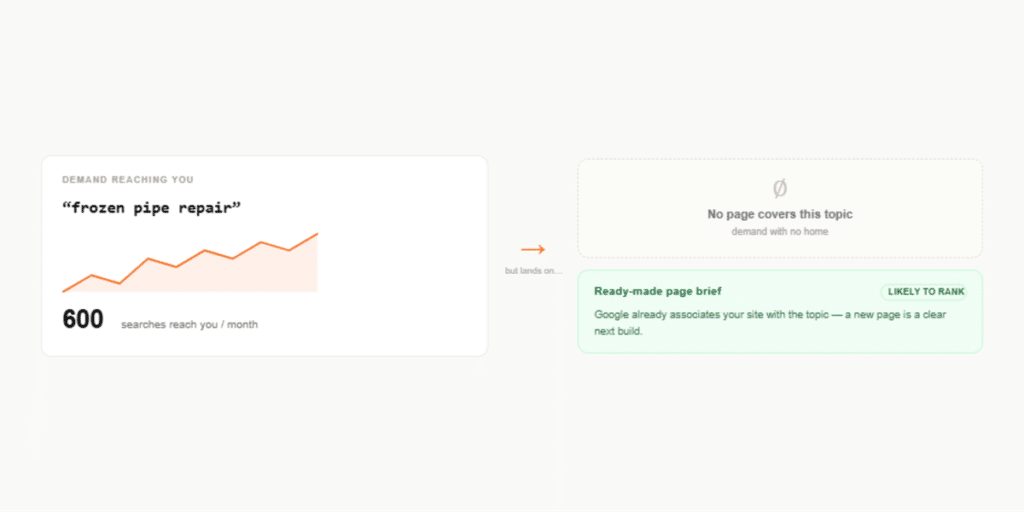
That’s demand with no home — a ready-made brief for a new page that’s likely to rank, because Google already associates your site with the topic.
Position Movers
“sewer line replacement” climbed from position 14 to 6 since the last period, while /faucet-repair ” slipped from 4 to 9.
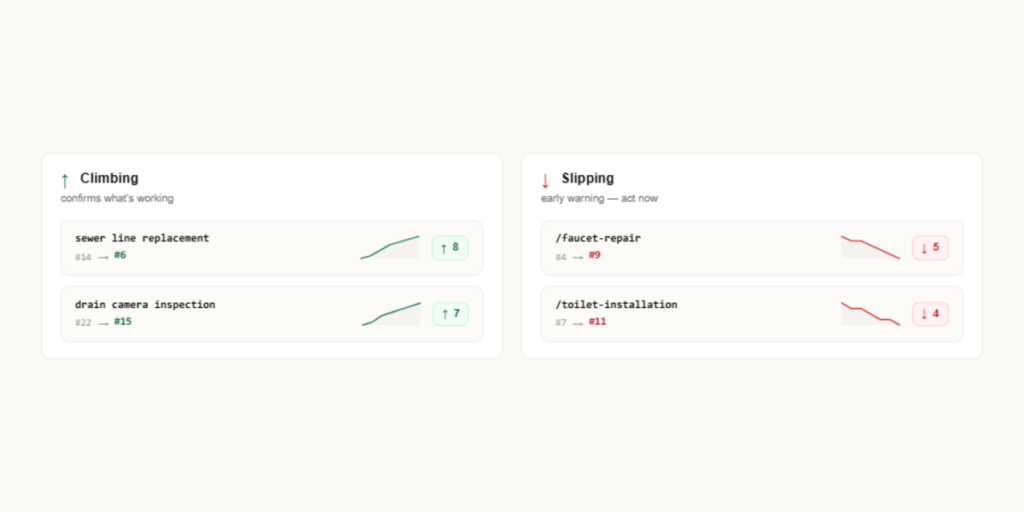
The win confirms what’s working; the slip is an early warning you can act on before it becomes lost traffic.
KW Difficulty
“emergency plumber” scores as hard for you, given your position and the competition, while “garbage disposal repair chicago” scores as winnable.
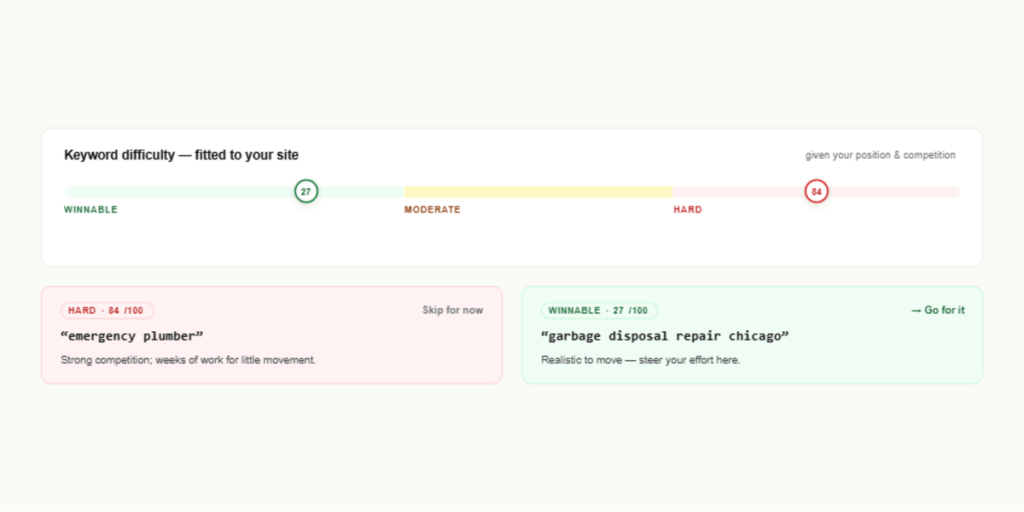
You steer effort toward the realistic target instead of burning weeks on a query you’re unlikely to move.
Content — page- and section-level health
Content Decay
/water-heater-buying-guide earned 500 clicks a month a year ago and now earns 180, still sliding.
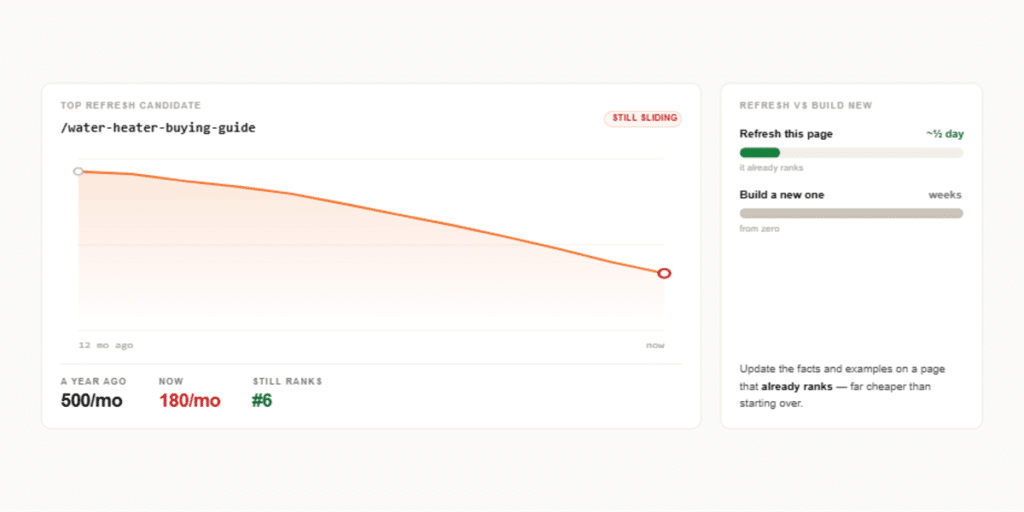
It tops your refresh list — updating the facts and examples on a decaying page that already ranks is far cheaper than building a new one from scratch.
Scorecard
/sump-pump-installation grades a D — strong position, but collapsing click-through and a downward trend.
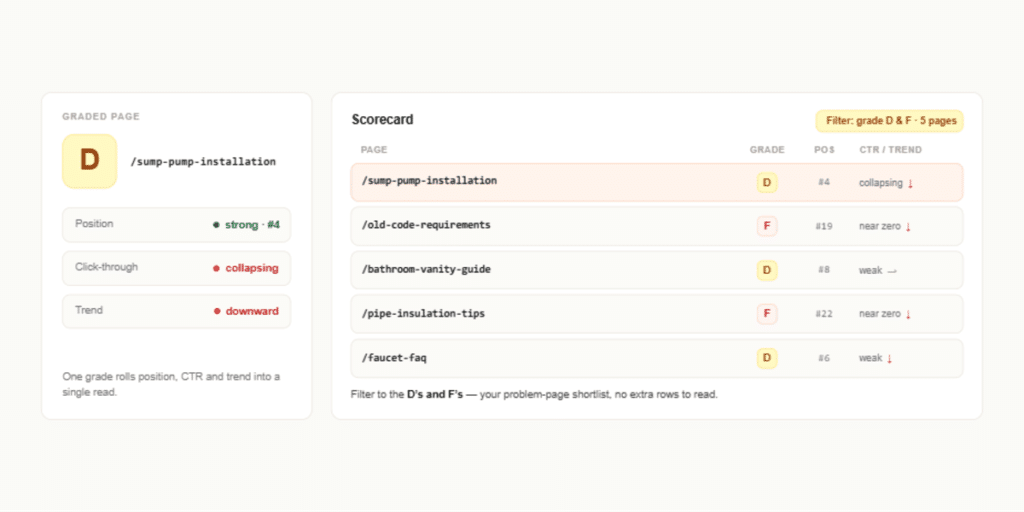
Filter to the D’s and F’s, and you’ve got your problem-page shortlist without reading a single extra row.
Trend Direction
/repiping-guide is trending up, /faucet-faq is flat, and /old-code-requirements is trending down.
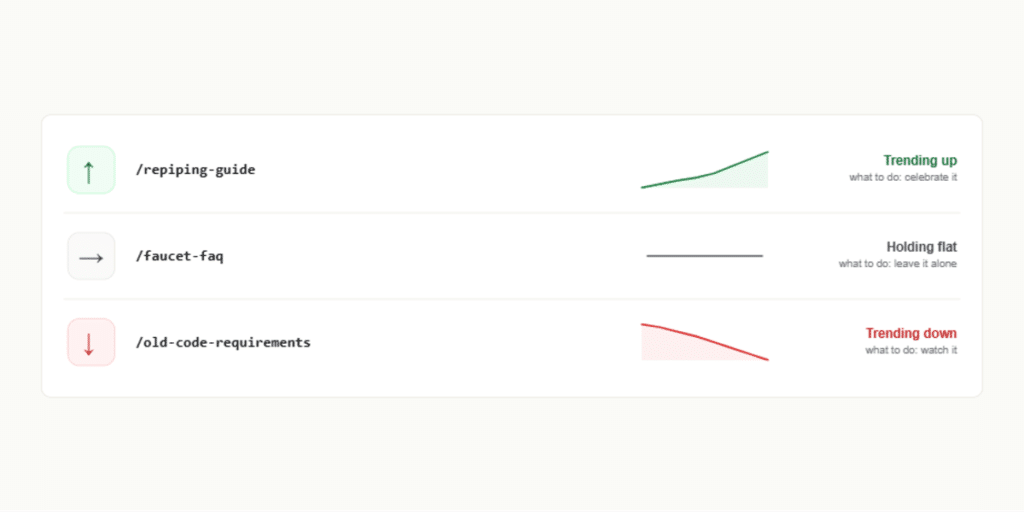
A simple up/flat/down read tells you what to celebrate, what to leave alone, and what to watch — at a glance.
Position Heatmap
The grid shows a healthy cluster of green near the top and a dense band of pages stuck at positions 11–15.
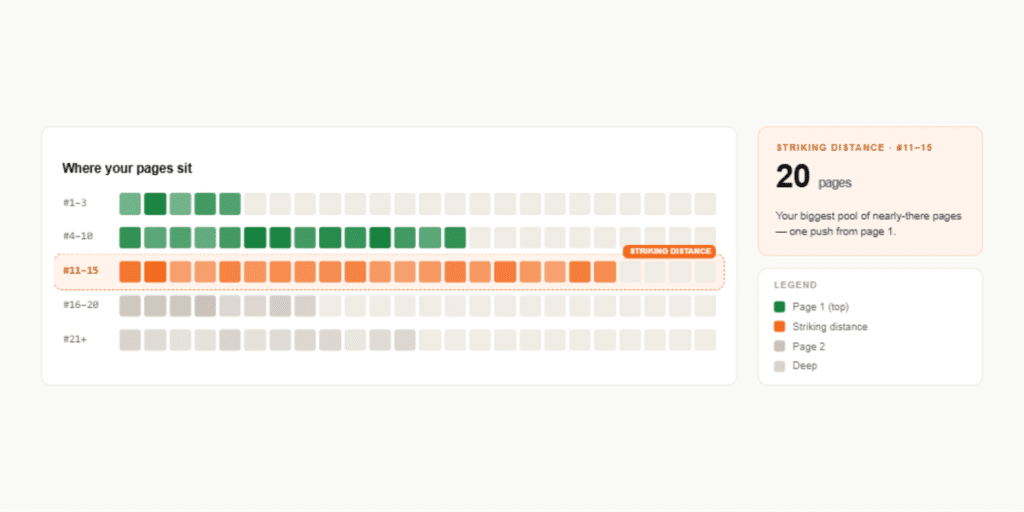
That band is your biggest pool of striking-distance pages, visible instantly instead of buried in a sort.
Link Gaps
Your high-authority /water-heater-repair page doesn’t link to the striving /tankless-water-heaters page on a closely related topic.

Adding one internal link passes authority exactly where it’s needed — minutes of work for a measurable ranking nudge.
Site Sections
/blog/ pulls strong traffic while /courses/ underperforms relative to its size.
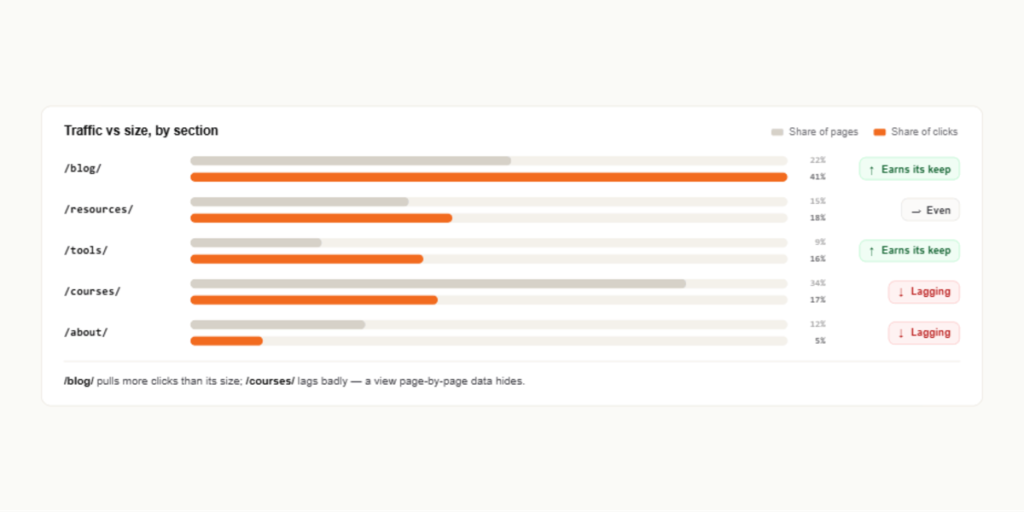
You see which parts of the site earn their keep and which lag, guiding where to invest — a view that page-by-page data hides.
Traffic — the “who and how” of your visitors
Branded Split
70% of your clicks come from people searching your brand by name; only 30% from discovery terms like “plumber near me.”
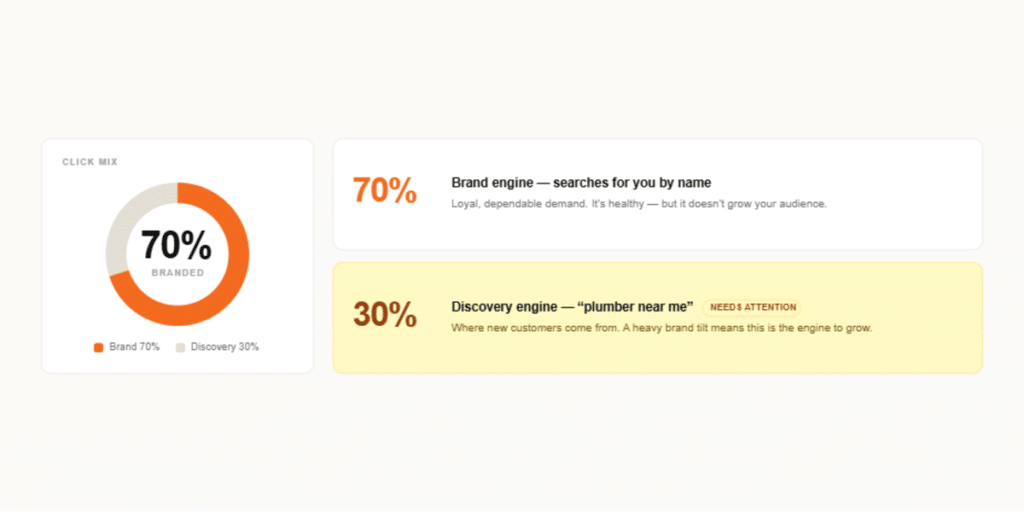
A heavy brand tilt means loyal demand but limited new-audience growth — the balance tells you which engine needs attention.
Device Split
Desktop ranks at position 4 for your key queries, but mobile sits at 8.
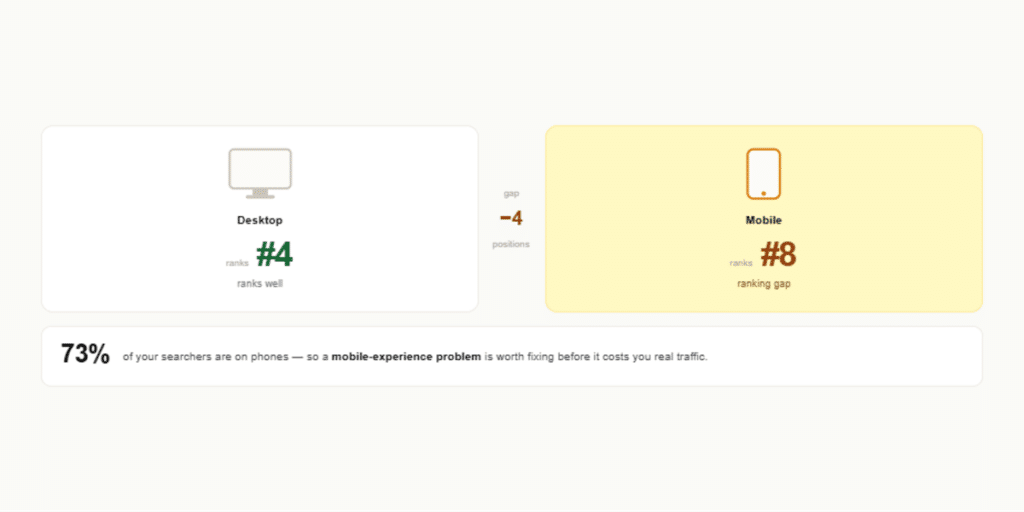
A mobile ranking gap points to a mobile-experience problem worth fixing, since most of your searchers are on phones.
Country Split
You expected US-only traffic, but 15% comes from Canada.
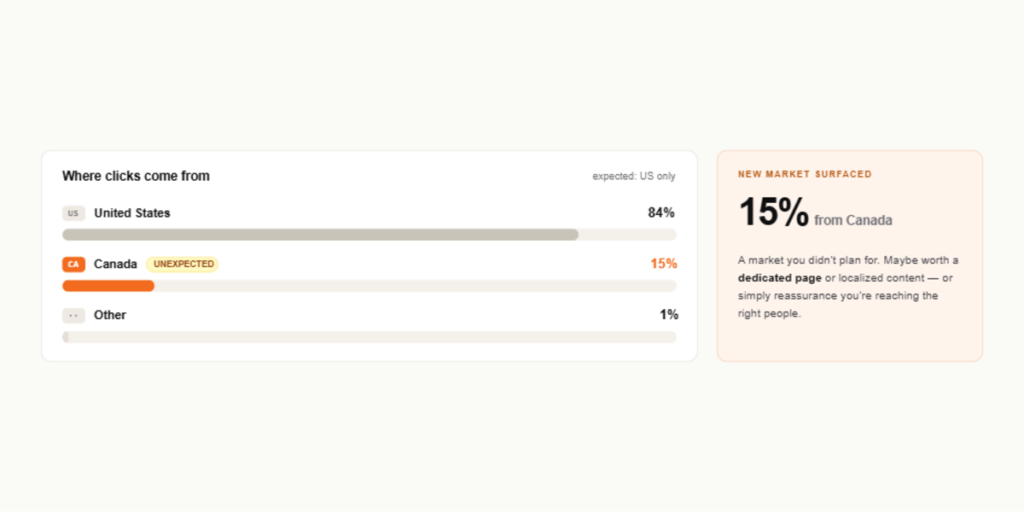
An unexpected market surfaces — maybe worth a dedicated page or localized content, or simply reassurance you’re reaching the right audience.
Search Type
8% of your impressions come from Google Images rather than web search.
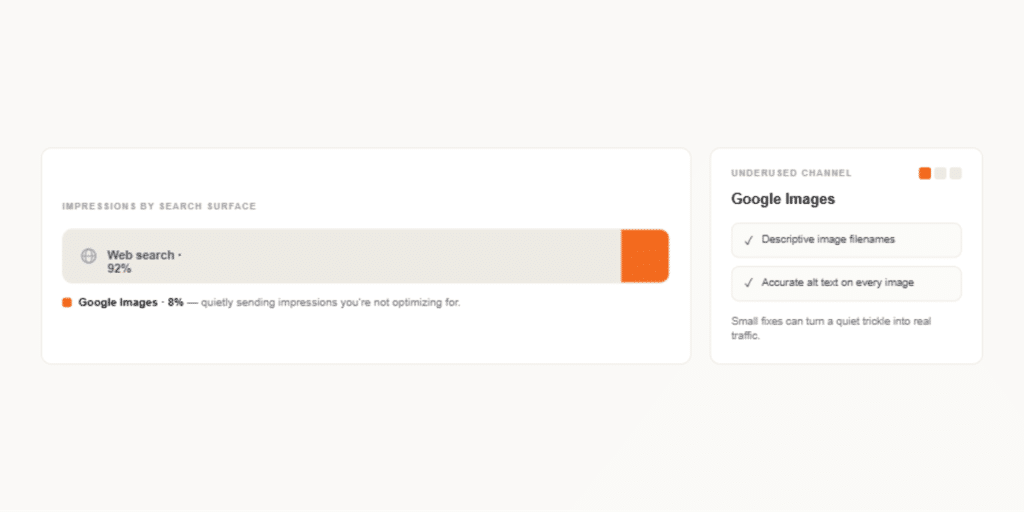
An underused channel reveals itself — better image filenames and alt text could turn a quiet trickle into real traffic.
Rich Results
Your review-star results earn double the click-through of plain listings.
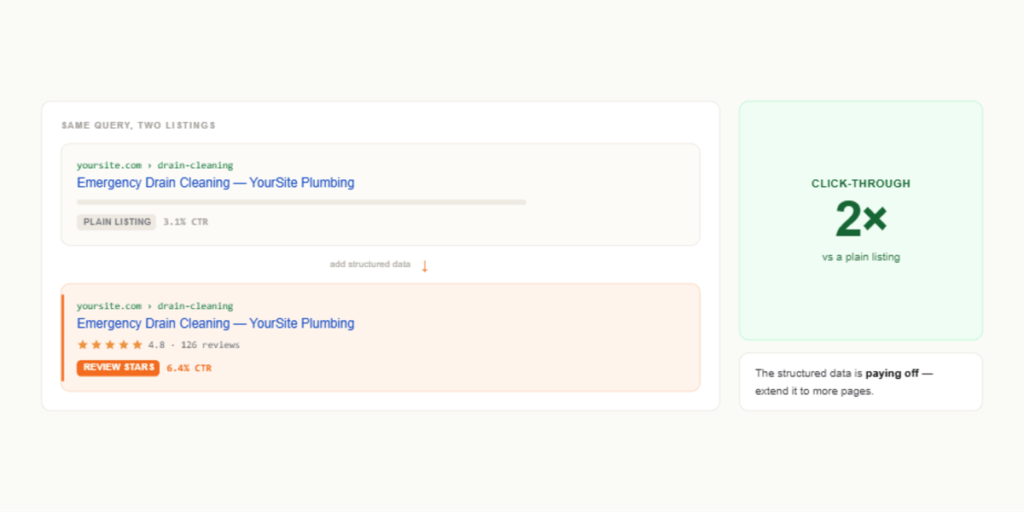
The structured data is paying off — confirmation that the investment works, and a nudge to extend it to more pages.
Every one of these tabs carries a built-in “How this works” explainer, so you’re never taking a number on faith.
The thing that makes it different: it refuses to lie to you
Plenty of tools will turn data into confident-sounding conclusions. The harder, rarer discipline is knowing when not to. GSC Decoder is built on a principle that runs through every module: honest design over optimistic framing.
This isn’t caution for its own sake. It’s what makes the recommendations trustworthy. A tool that cries “critical!” at everything trains you to ignore it. GSC Decoder uses a single, magnitude-based rubric for what counts as critical versus a warning across every module — so when the Overview, the Fix Queue, and an individual tab all agree that something matters, it actually does.
Connect it your way
You can feed the GSC Decoder two ways, and almost everything works on either.
Connect your Google Search Console account (recommended), and the tool pulls data directly — pick a range from the last 12 months down to the last 28 days. This unlocks date-aware features such as Recovery’s recency buckets and Click Drops’ day-level detection, which rely on per-period data only the API can provide.
Or upload your CSV exports of Queries and Pages. This powers the large majority of modules and is a solid fallback when connecting the account isn’t an option.
One small but important setup step: tell the tool your brand terms. Searches for your own name behave completely differently from discovery searches — people click them at nearly 100% regardless of rank — so filtering them out sharpens almost every calculation in the tool. It takes thirty seconds and makes everything downstream more accurate.
Getting started
- Open the tool. Head to GSC Decoder to get started — there’s nothing to install.
- Connect your data. Link your Search Console account, or upload your Queries and Pages CSV exports. The Connect screen walks you through it.
- Set your brand terms in the settings so brand and discovery searches are kept separate.
- Start at the Overview for the health score and the “right now, do this” shortlist.
- Work the Fix Queue — one prioritized, de-duplicated list, with your progress saved on your device.
- Go deeper by tab whenever you want the full story behind a finding.
The point
Search Console already tells you the truth about your search performance. The problem was never the data — it was the distance between the data and a decision. GSC Decoder closes that distance, and it does it without inventing numbers, inflating urgency, or pretending to know things it can’t.
Open it, read the Overview, and work the Fix Queue. The answer that used to be buried in ten thousand rows is now the first thing you see.
GSC Decoder is brought to you by IntentiveSEO. Plain-English insights, honestly scoped — because the best SEO advice is the advice you can actually trust.